

|

|
We present a user-guide for helping in understanding the wide range of analysis MAP offers to the final user.
microRNAs and Covid-19
microRNAs and Breast cancer -- Analysis on subset of samples
Launch an analysis with mirCompare
MAP, the microRNAs Analysis Portal is a powerful resource to create meaningful biological queries.
MAP relies on SMAC, an automated data selection and retrieval system previously implemented by our group.
Gene Expression Omnibus (GEO) identifiers are used to establish computational links between literature and any associated data.
If data is available in the public domain, the system downloads the relevant files and feed an analytical pipeline.
Once you access to the Explore tab, you can choose to explore the literature data in a more general OR miRNA-focused manner.
In both cases, queries can be conducted with ease and built in a logical manner.
Explore -- literature allows the researcher to query miRNA-related publications according to literature features, medical terms, interaction genes.
Explore -- microRNA lists all the publications relevant to the microRNAs stored and characterised in miRBase. Users can select relevant publications by
choosing one or more microRNAs of interest. Set of papers can be further refined according to literature features AND medical terms
An interactive table containing the details of samples composing the dataset, is presented to the user. Columns (features) can be shown/hide by single clicks. Data can be also exported in tabular format (TSV), excel and PDF. A sample bag can be created by selecting on multiple rows of the table. We can then apply the bioinformatics pipeline and watch the results in real time.
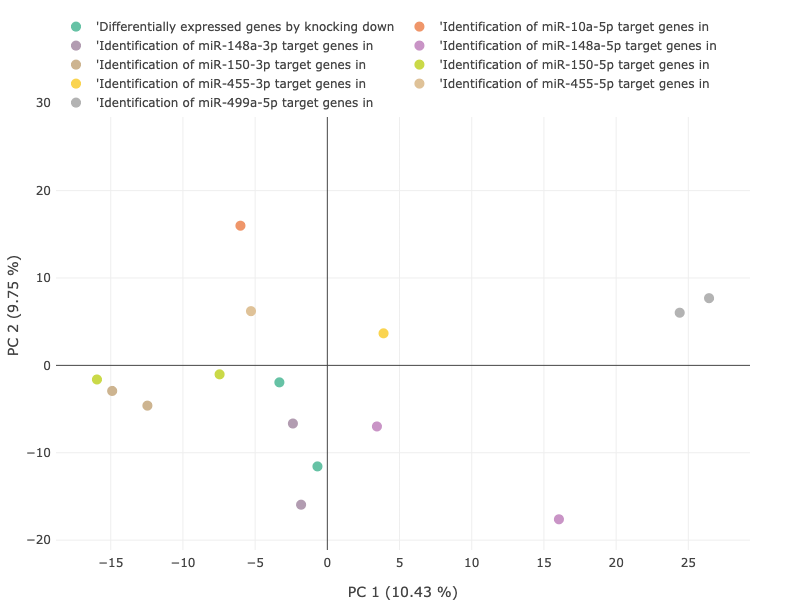
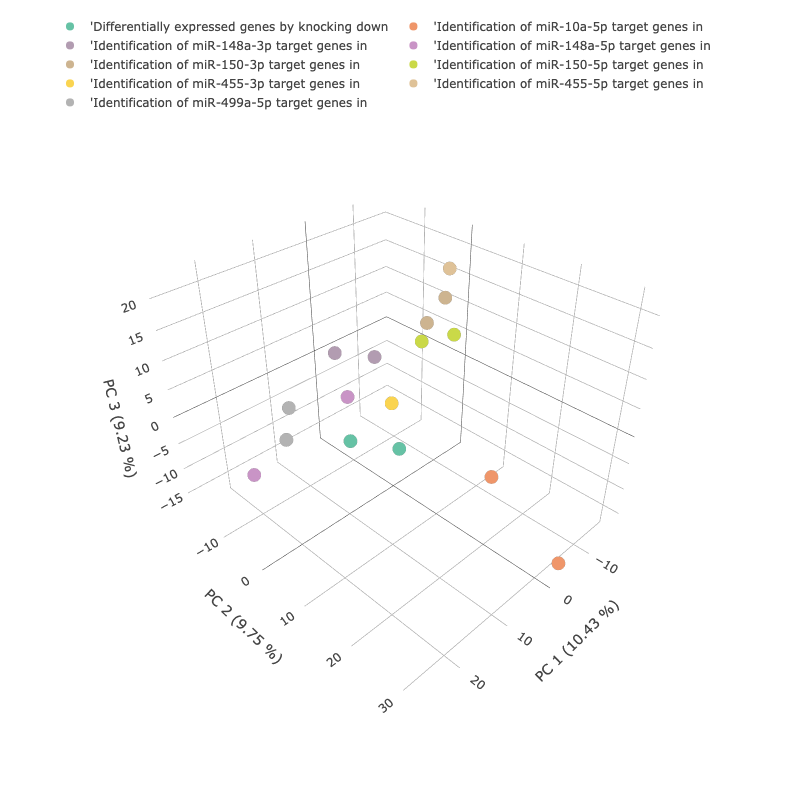
Principal component analysis (PCA) reduces the dimensionality of data while retaining most of the variation in the dataset,
making it possible to visually assess similarities and differences between samples and determine whether samples can be grouped.
This exploratory analysis makes easier to identify the key factors that could affecting the variability within expression data.
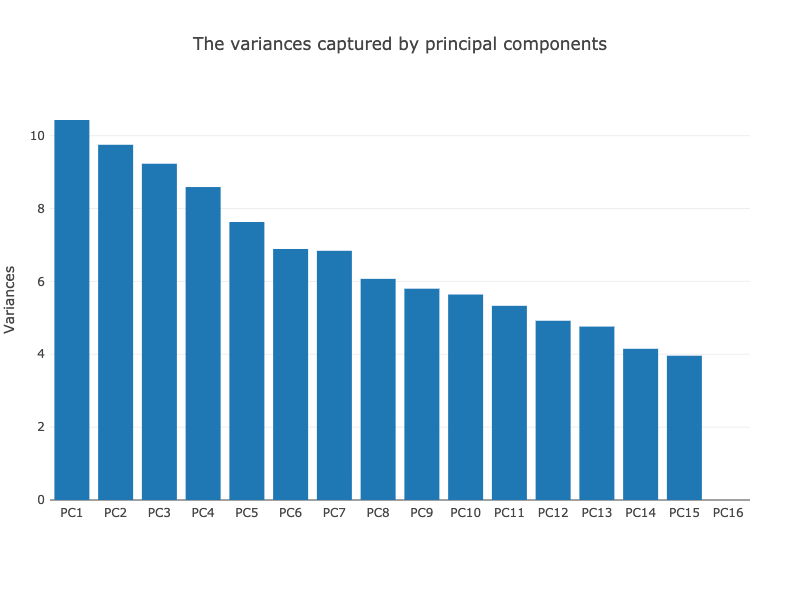
For each dataset, scatterplots representing the first two (2) and three (3) principal components (PCs) of the data are presented.
The global variability of the data can also be assessed from the barplot that shows the fraction of total variance (y-axis) attributed to each PC (x-axis)
 |
 |
 |
|
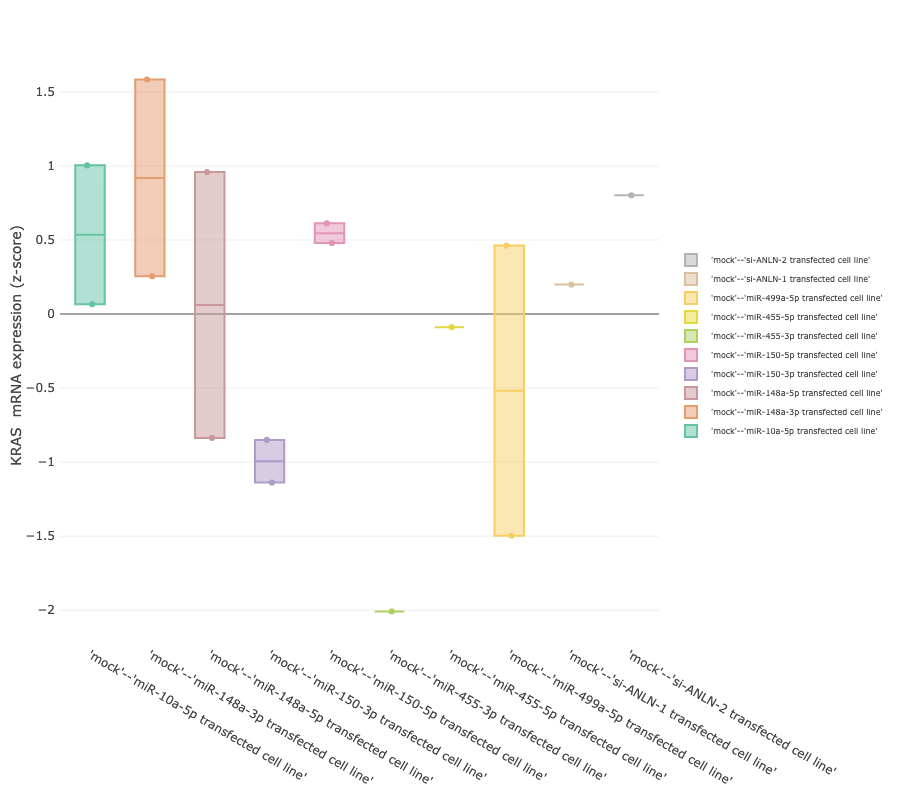
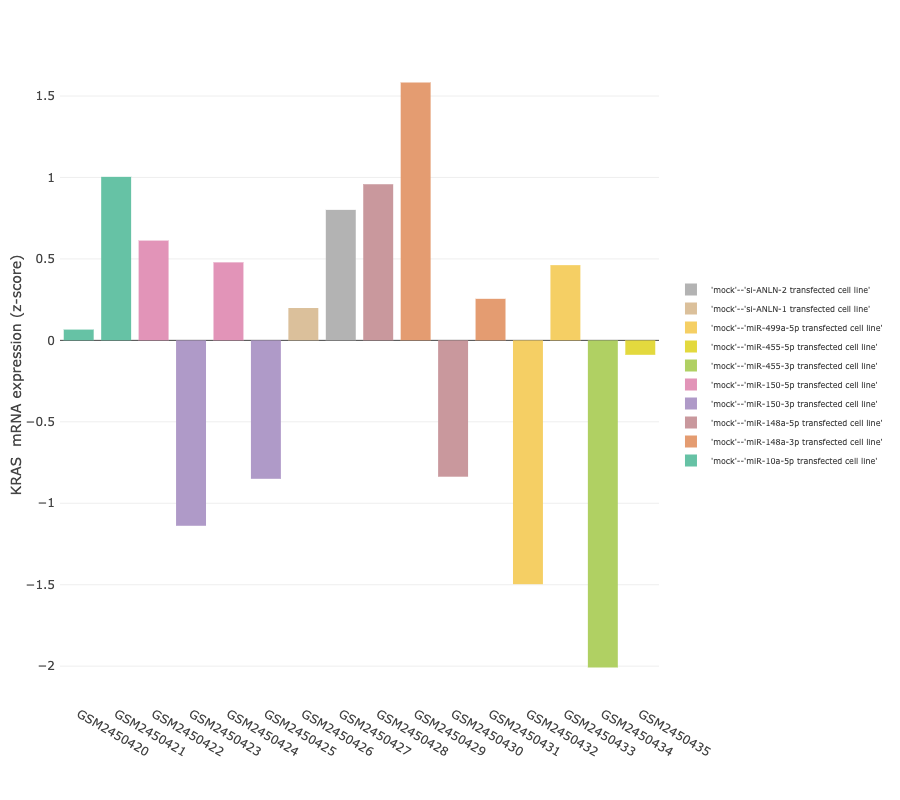
The genes-specific feature allows to track changes of a gene of interest across different biological
conditions. In order to provide a comprehensive overview of expression values across the biological groups, results are presented as both
summarised and a sample views (box plot and bar plot, respectively).
The box plot shows mRNA expression level quartiles (y-axis) in samples,stratified according to their group (x-axis).
To better explore the granularity of differences, a barplot in which the expression values of individual samples (bars) is also provided.
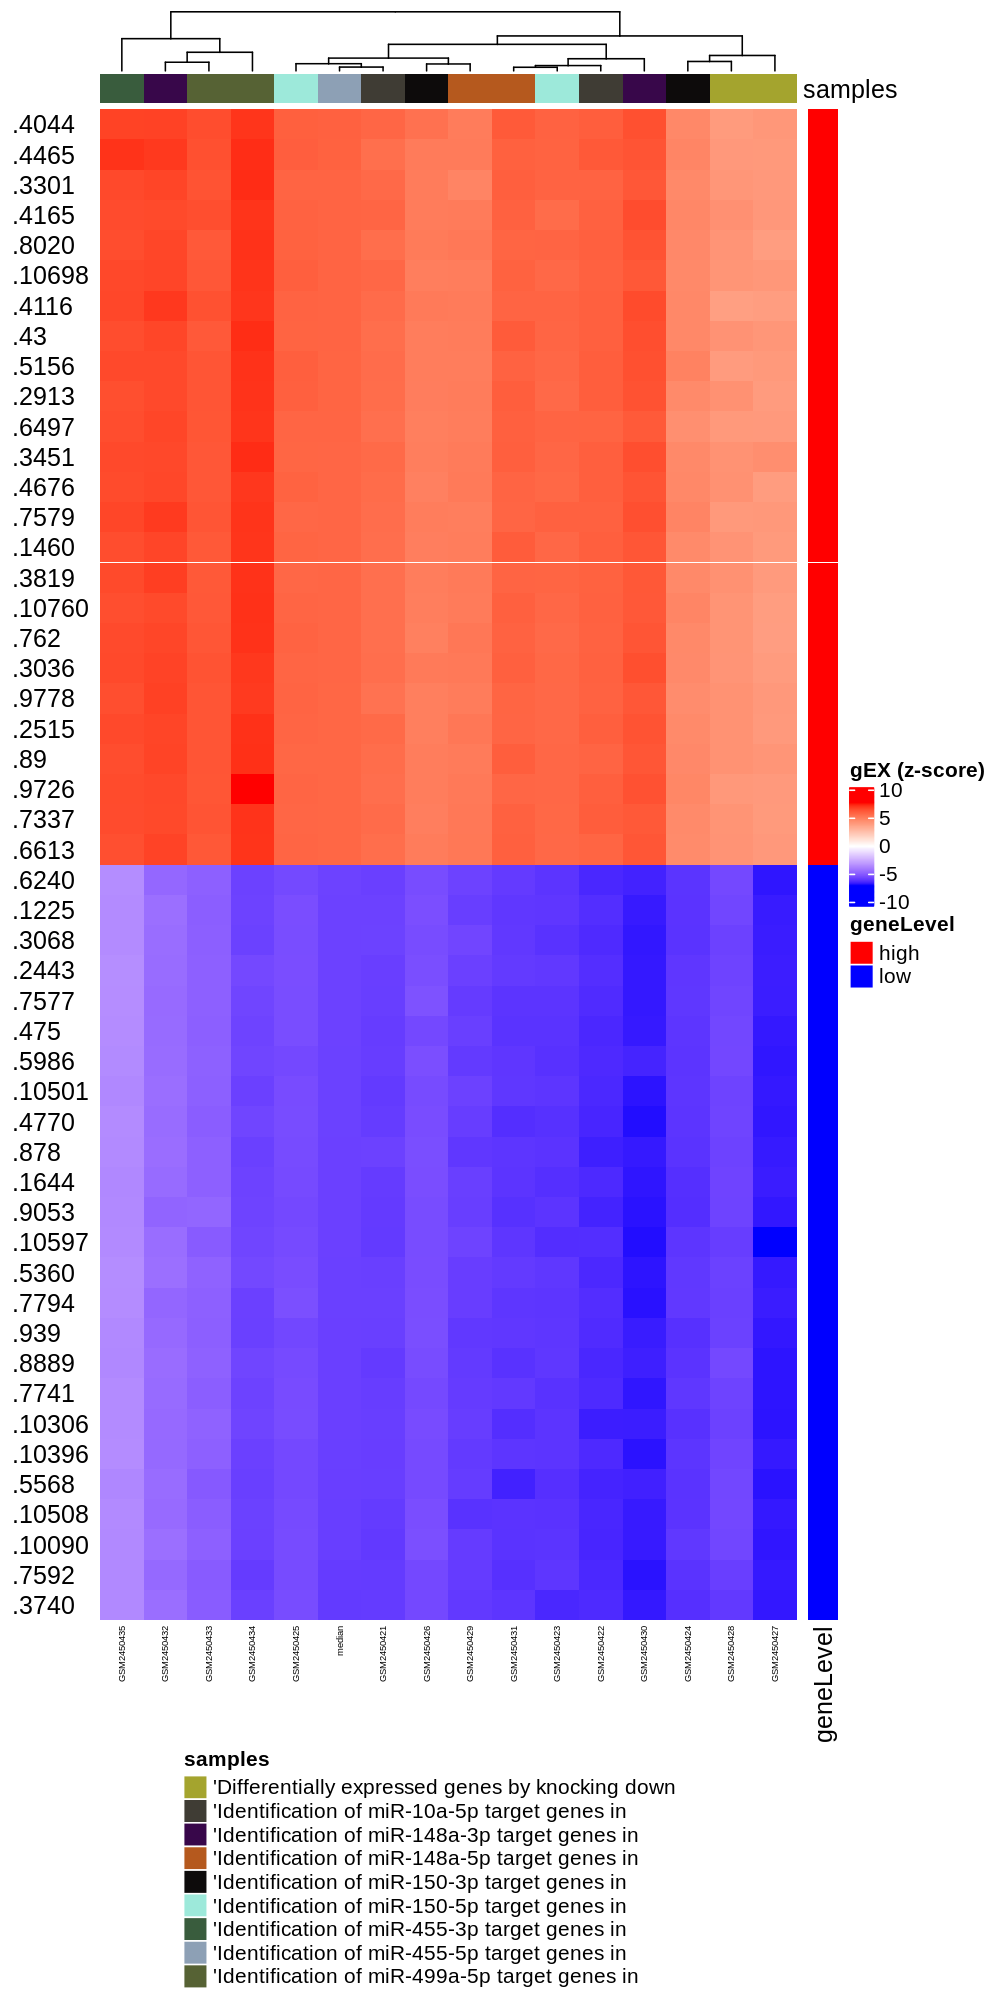
In the Differentially expressed tab, the normalised expression levels (z-scores) for the most variable genes (n = 100)
is presented across all samples in the GEO dataset. Moreover, samples are clustered according to their expression profiles
for the subset of genes. This analysis produces a heatmap where rows and columns represent genes and samples, respectively.
 |
 |
 |
|
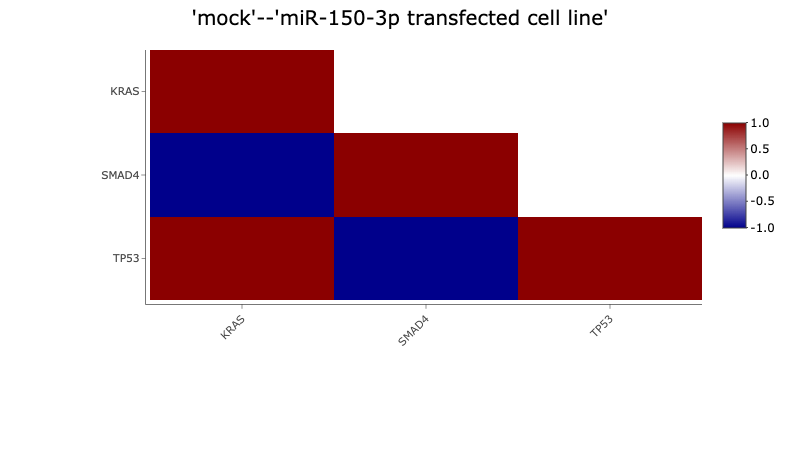
This module allows to perform a pairwise comparisons of expression levels between multiple, user-defined genes (at least 2 and up to 50) in the same dataset.
For each comparison, Pearson's correlation coefficients and p-values are calculated.
Results are presented in a form of heatmap. The colour of each cell indicates correlation coefficient between corresponding
genes labelled on the x-axis and y-axis. The heatmap colour key is displayed on the right-side of the plot with red and blue
indicating high and low correlation values, respectively.
 |
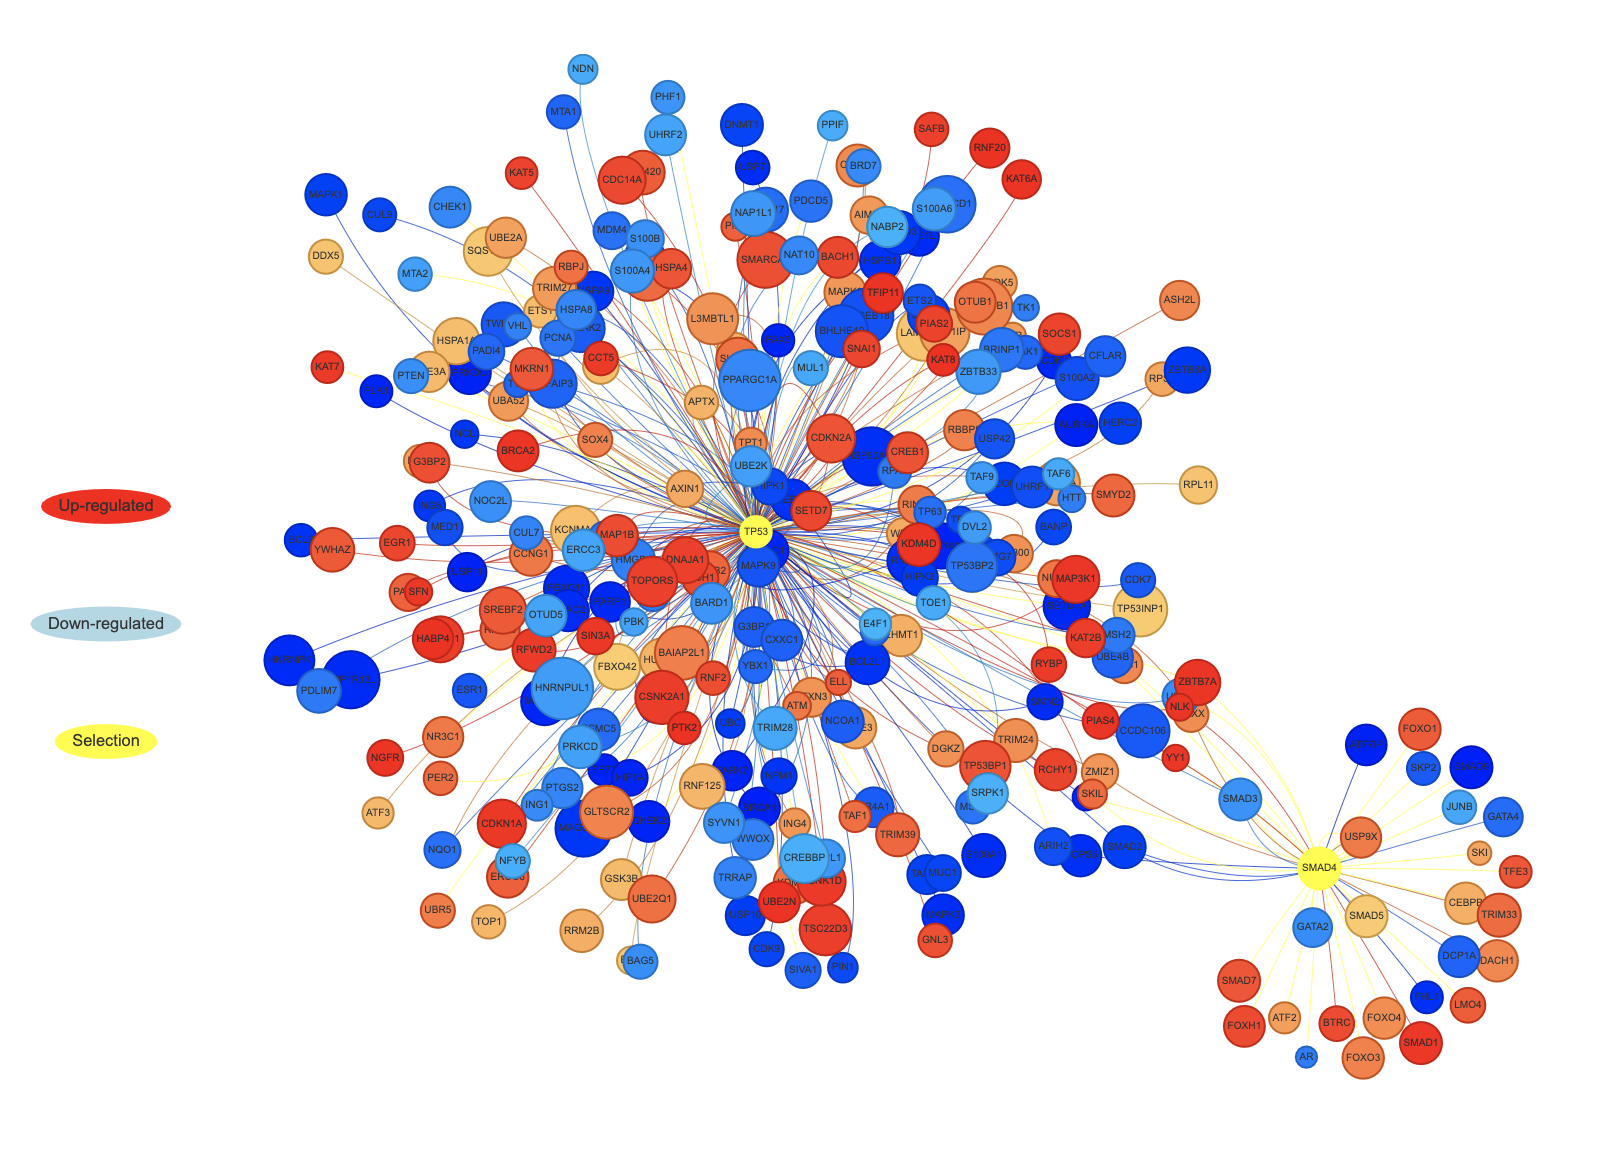
For each comparative group defined in the dataset, the interactions between genes of interest and their primary neighbours can be displayed in an interactive network. In the resulting gene networks, nodes represent the genes while edges represent the interactions. Nodes are coloured according to the expression level (z-score) in the dataset of interest.
 |
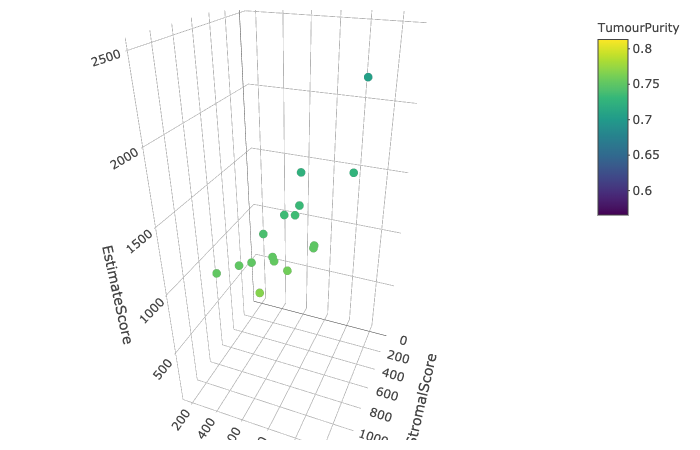
Tumour samples frequently contain a small proportion of infiltrating stromal and immune cells that may introduce noise in
detecting the tumour signal and be actively involved in tumourigenesis and progression. Starting from (array) expression data,
we apply the ESTIMATE algorithm for calculating stromal score, immune score and estimate score, in order to infer tumour purity.
Results of the analysis are presented in a form of 3D scatter plot, representative of stromal, immune and estimate score.
Each sample (dot) is coloured according to the corrensponding tumour content. A table is also provided, in order to filter
samples according to their purity.
Please note: as clearly stated by the authors, ESTIMATE method cannot be applied on RNA-seq data. For this reason,
the analysis is performed JUST on array expression datasets.
 |
Please note: SMAC system is able to detect cancer samples BUT is not able to discriminate breast cancer samples for other types.
In any case, we aim at introducing this analytical module into MAP, that is meaningful in the analysis of breast cancer samples
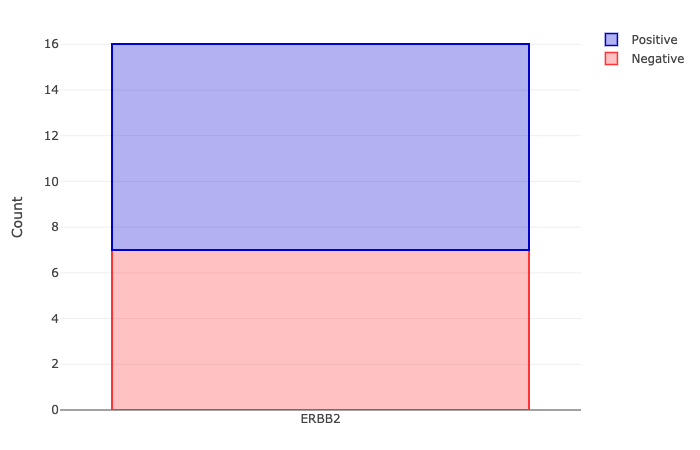
A Gaussian finite mixture modelling is applied to the expression data, to assign each sample a molecular status for
oestrogen (ER), progesterone (PR) and Her2 receptors. Subsequently, the triple negative samples are identified and highlighted.
The receptor status for ER, PR and Her2, as well as triple negative samples, are presented as stacked barcharts.
 |
Please note: SMAC system is able to detect cancer samples BUT is not able to discriminate breast cancer samples for other types.
In any case, we aim at introducing this analytical module into MAP, that is meaningful in the analysis of breast cancer samples
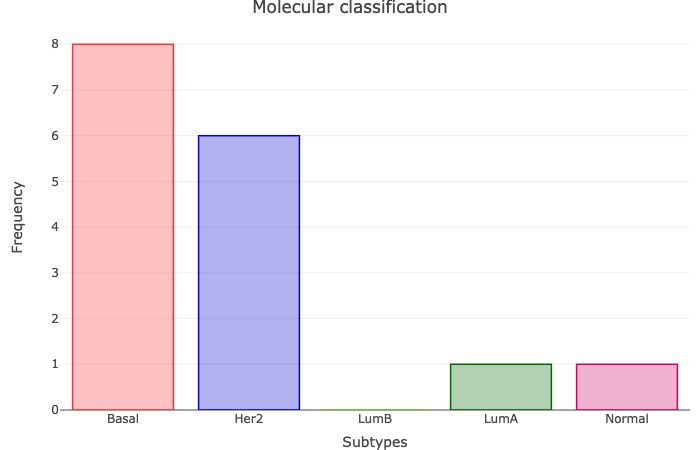
Several studies focused on breast cancer gene expression, identified five molecular oestrogen receptor positive subtypes (Luminal A and Luminal B)
and oestrogen receptor negative subtypes (Basal-like, Her2-enriched and Normal breast-like).
This module applies the PAM50 single sample predictor model and assigns samples into intrinsic tumour types.
An overview of molecular subtype calls for tumour samples is presented as a barchart.
 |
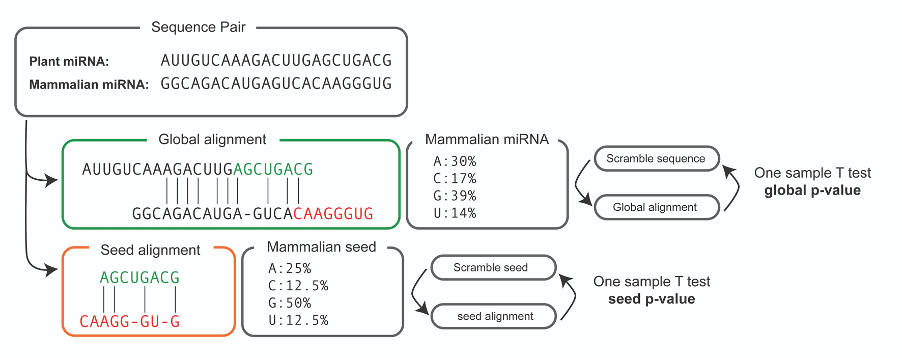
MirCompare confront libraries of miRNAs belonging to organisms from plant and animal kingdoms, to find cross-kingdom functional homologies. MAP integrates a major update of MirCompare that aims at improving the speed and quality of predictions, while respecting the concept of functional homology coined by our previous studies. Analyses are submitted in background to a dedicated server, respecting a queueing system. When the analysis is completed, the results are sent to the final user by email to be downloaded, visualised and (eventually) further analysed.
We dramatically improved the methodology of alignment, introducing a scoring system that takes into consideration the presence of open and extended gaps in the global (whole sequences) and local (seed-specific) alignments. In accordance with our previous version, the global alignment score between two sequences SA,B is defined as the number of matches respect to the maximum length. For this reason, the global alignment assigns +1 in case of match, 0 otherwise. The seed-specific alignment is required to be much more stringent than the global one. For this reason, such penalties have been assigned to mismatches (-0.5) open gaps (-1) and extended gaps (-1).
One of the biggest improvements we implemented, is the calculation of the statistical significance for each performed comparison. Given two sequences A (from plant) and B (from mammalian) we aim at assessing if the magnitude of the comparison is far from the randomness. For this reason, we determine the percentage of nucleotides in B sequence and we generate 100 scramble sequences (B’) accordingly. Then, a series of 100 SA,B’ are calculated and a One-sample T test is performed. This approach is applied on both the global (whole sequence) and local (seed region) alignments, resulting in two distinct p-values for each comparison.
 |
Once a list of comparisons between plant and mammalian microRNAs is generated, MirCompare identifies the target genes in the host species.
In order to perform this operation, we assume that plant microRNAs regulate host mRNA translation in analogous manner of mammalian counterparts.
The first part comprises the selection of genes experimentally proven to interact with the pool of selected microRNAs. For this purpose,
MirCompare queries DIANA-TarBase v.8.0, the most up-to-date collection of experimentally supported interactions
between microRNAs and targets.
Retrieved records are then ranked according to the robustness of supporting methodologies and presented to the final user in a form of a TSV (tab-separated) file.
A second step consist in the in-silico prediction of new, putative target genes. To this aim we use ComiR ,
an algorithm based on a support vector machine (SVM) for combining the predictive power four popular scoring schemes
(miRanda, PITA, TargetScan and mirSVR).
Since this process can be very long, we pre-computed the targets for H. sapiens and M. musculus.
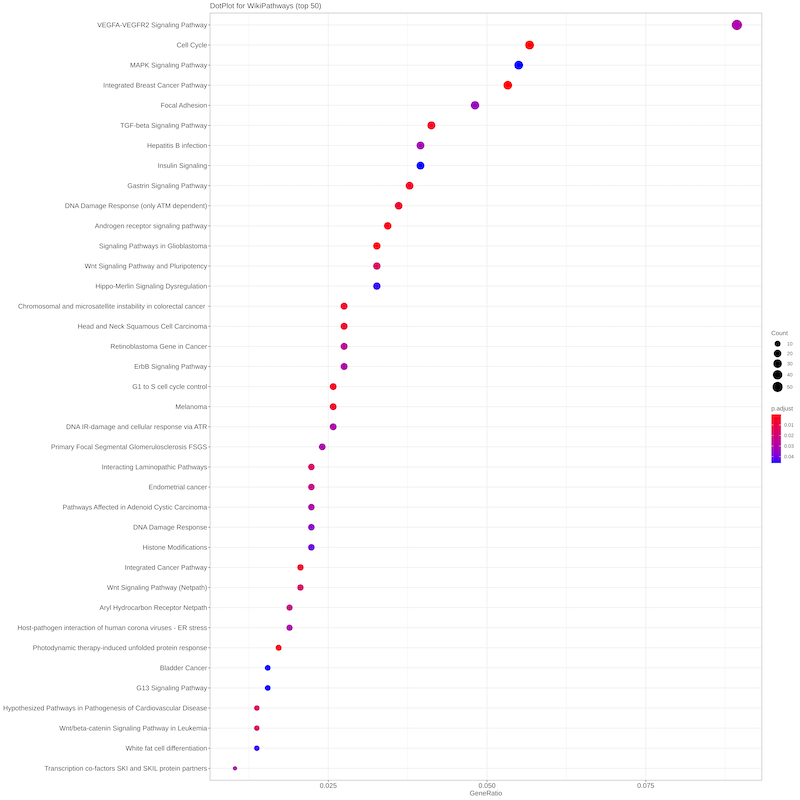
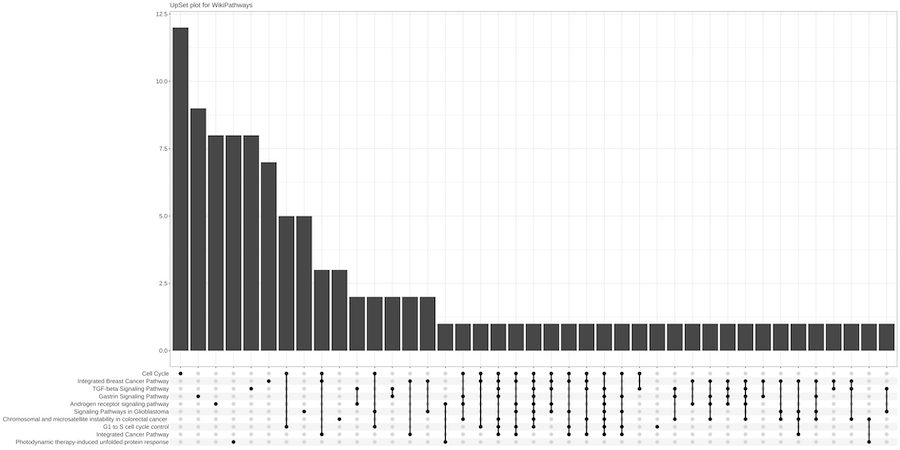
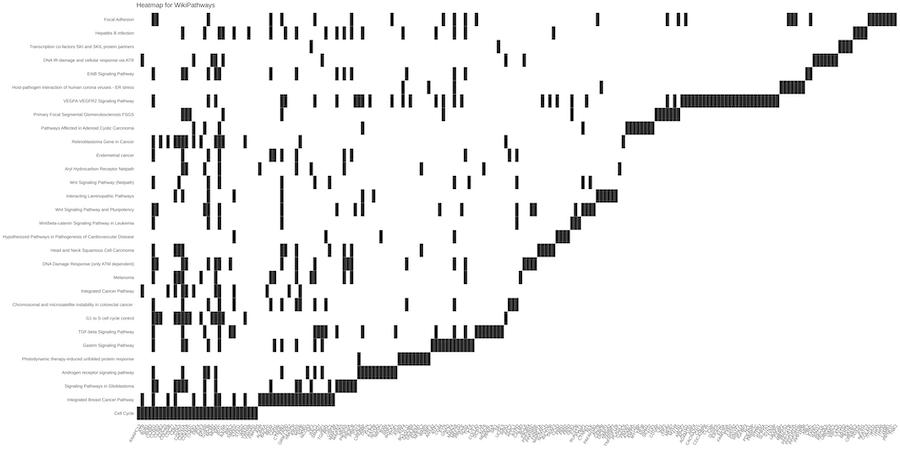
Starting from the list of genes that are putatively targeted by plant miRNAs, a central Over Representation Analysis (ORA) is applied to determine
whether known biological functions or processes are over-represented (enriched) respect to the background. A p-value is also calculated by hypergeometric
distribution and adjusted for multiple comparisons. MirCompare uses the R package ClusterProfiler for enquiring many different
ontologies and signatures (WikiPathways, MSigDB, Disease Ontology,
Network of Cancer Genes, DisGeNET, Gene Ontology,
KEGG, REACTOME).
The results of each enrichment are summarised in both graphical and tabular formats.
 |
 |
 |